Recipes
# Preprocessors -----------------------------------------------------------
recipe_date <- recipe(value ~ ., data = data) %>%
 step_date(date, features = c('dow','doy','week','month','year'))

recipe_date_fourier <- recipe_date %>% step_fourier(date, period = 365, K=1)
Models
# Models ------------------------------------------------------------------
mars <- mars(mode = 'regression') %>% set_engine('earth')

prophet_boost <- prophet_boost(mode = 'regression') %>% set_engine("prophet_xgboost")
Workflowsets
wfsets <- workflow_set(
 preproc = list(base = recipe_date,
                fourier = recipe_date_fourier),
 models  = list(M_mars = mars,
                M_prophet_boost = prophet_boost),
 cross   = TRUE)

wfsets
## # A workflow set/tibble: 4 x 4
##   wflow_id                info             option    result
##   <chr>                   <list>           <list>    <list>
## 1 base_M_mars             <tibble [1 × 4]> <opts[0]> <list [0]>
## 2 base_M_prophet_boost    <tibble [1 × 4]> <opts[0]> <list [0]>
## 3 fourier_M_mars          <tibble [1 × 4]> <opts[0]> <list [0]>
## 4 fourier_M_prophet_boost <tibble [1 × 4]> <opts[0]> <list [0]>
Fitted a Workflowset into a time serie
# Workflowsets fit --------------------------------------------------------
wffits <- modeltime_wfs_fit(.wfsets = wfsets,
                           .split_prop = 0.8,
                           .serie=data)
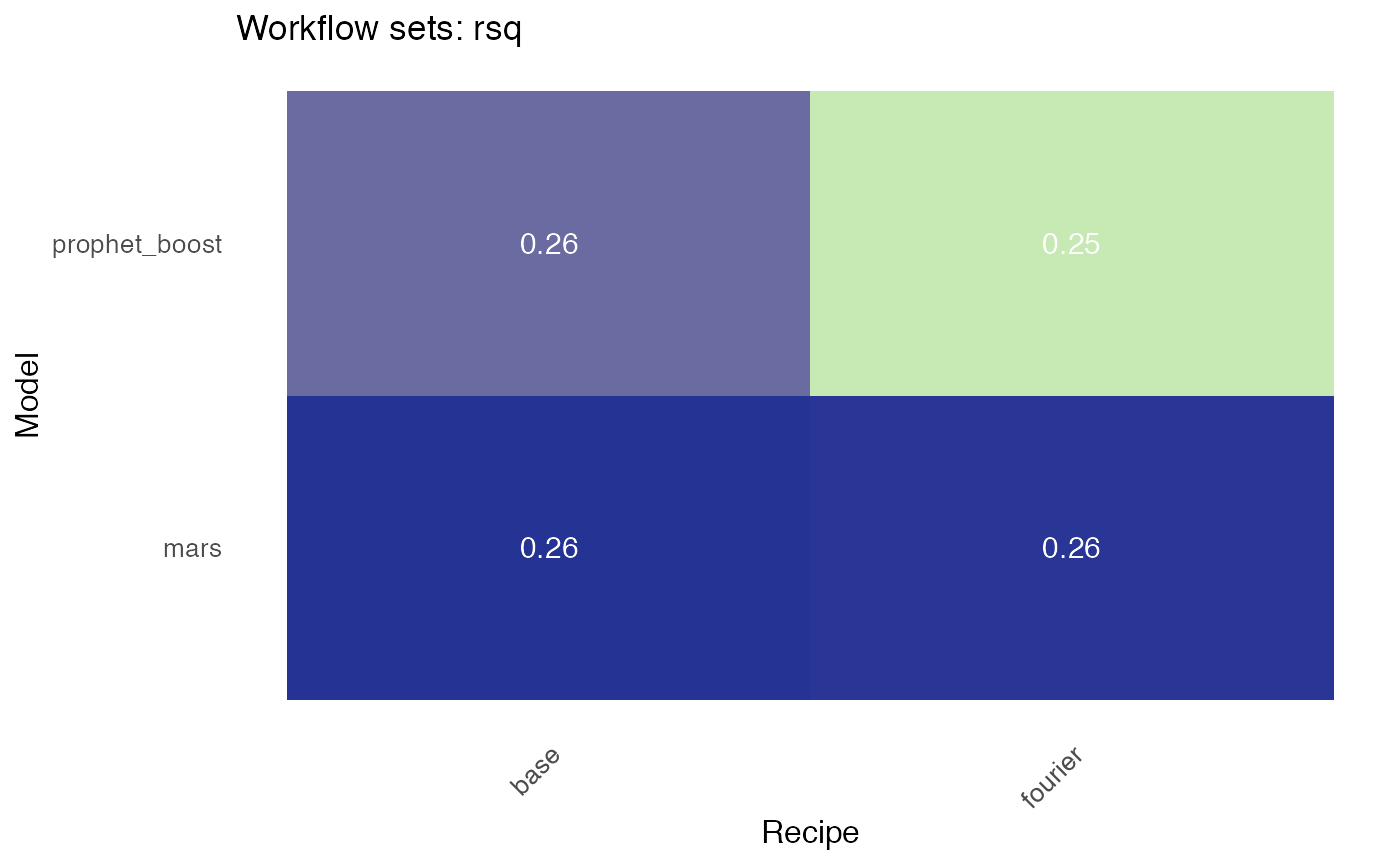
## # A tibble: 4 x 10
##   .model_id  .model_desc  .type    mae  mape  mase smape   rmse   rsq .fit_model
##   <chr>      <chr>        <chr>  <dbl> <dbl> <dbl> <dbl>  <dbl> <dbl> <list>
## 1 base_M_ma… EARTH        Test   9901.  9.30 0.598  8.66 15187. 0.260 <model_ti…
## 2 base_M_pr… PROPHET W/ … Test  10112.  9.23 0.610  8.85 15141. 0.257 <model_ti…
## 3 fourier_M… EARTH        Test   9944.  9.35 0.600  8.69 15236. 0.260 <model_ti…
## 4 fourier_M… PROPHET W/ … Test  10198.  9.32 0.616  8.92 15222. 0.253 <model_ti…
Heatmap models/recipes
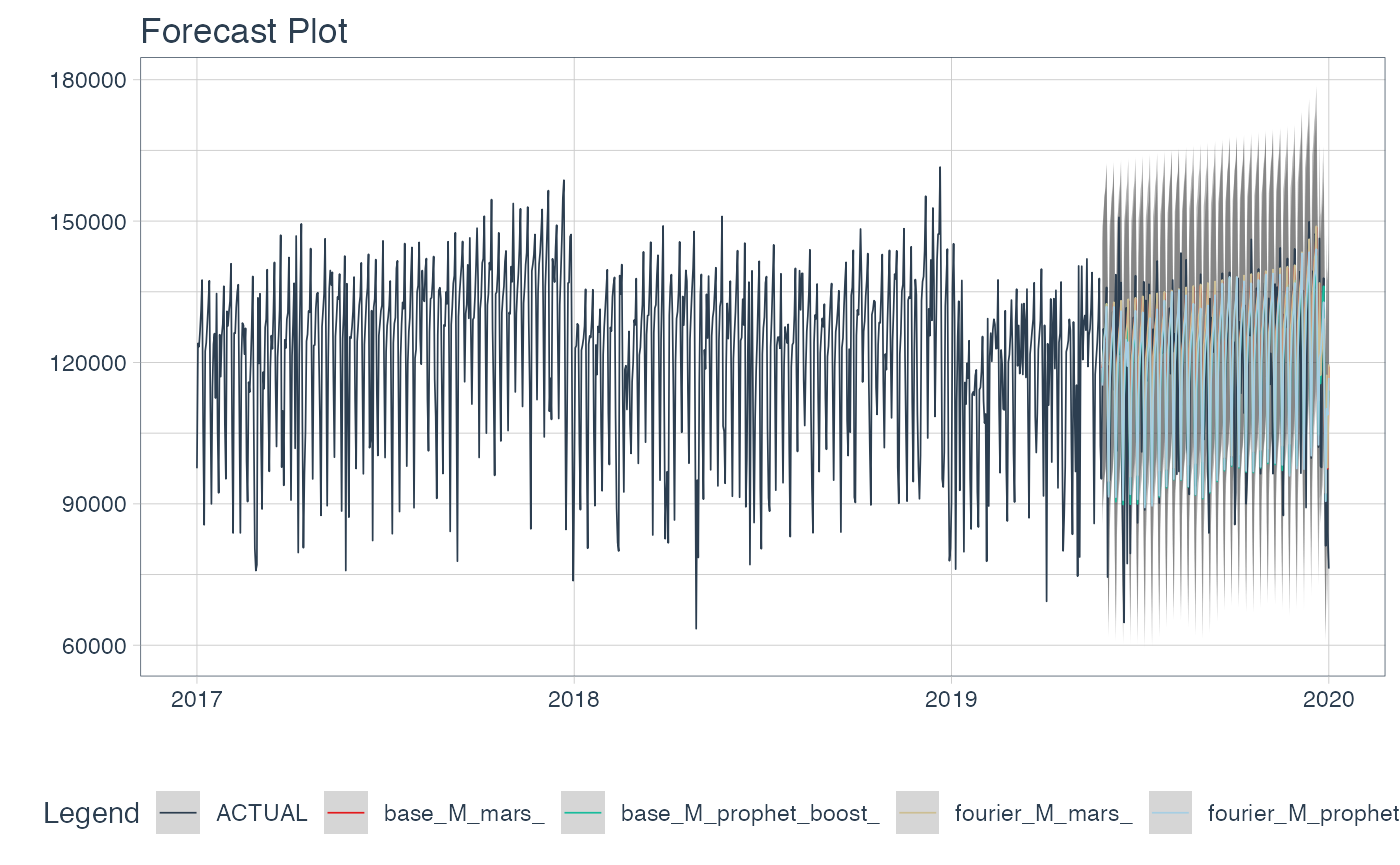
Visual Forecast in test
Ranking workflows
## # A tibble: 4 x 11
##   .model_id      rank .model_desc    .type    mae  mape  mase smape   rmse   rsq
##   <chr>         <int> <chr>          <chr>  <dbl> <dbl> <dbl> <dbl>  <dbl> <dbl>
## 1 fourier_M_pr…     1 PROPHET W/ XG… Test  10198.  9.32 0.616  8.92 15222. 0.253
## 2 base_M_proph…     2 PROPHET W/ XG… Test  10112.  9.23 0.610  8.85 15141. 0.257
## 3 fourier_M_ma…     3 EARTH          Test   9944.  9.35 0.600  8.69 15236. 0.260
## 4 base_M_mars       4 EARTH          Test   9901.  9.30 0.598  8.66 15187. 0.260
## # … with 1 more variable: .fit_model <list>
Select a top of workflows
# Select best model -------------------------------------------------------
wfbests <- modeltime_wfs_bestmodel(.wfs_results = wffits,
                                   .metric='rsq',
                                   .model = "top 2",
                                   .minimize = FALSE)
wfbests
## # A tibble: 2 x 4
##   .model_id       rank .model_desc .fit_model
##   <chr>          <int> <chr>       <list>
## 1 base_M_mars        1 EARTH       <model_time [1 × 3]>
## 2 fourier_M_mars     2 EARTH       <model_time [1 × 3]>
Refit in all data
# Refit -------------------------------------------------------------------
wfrefit <- modeltime_wfs_refit(.wfs_results = wfbests, data)
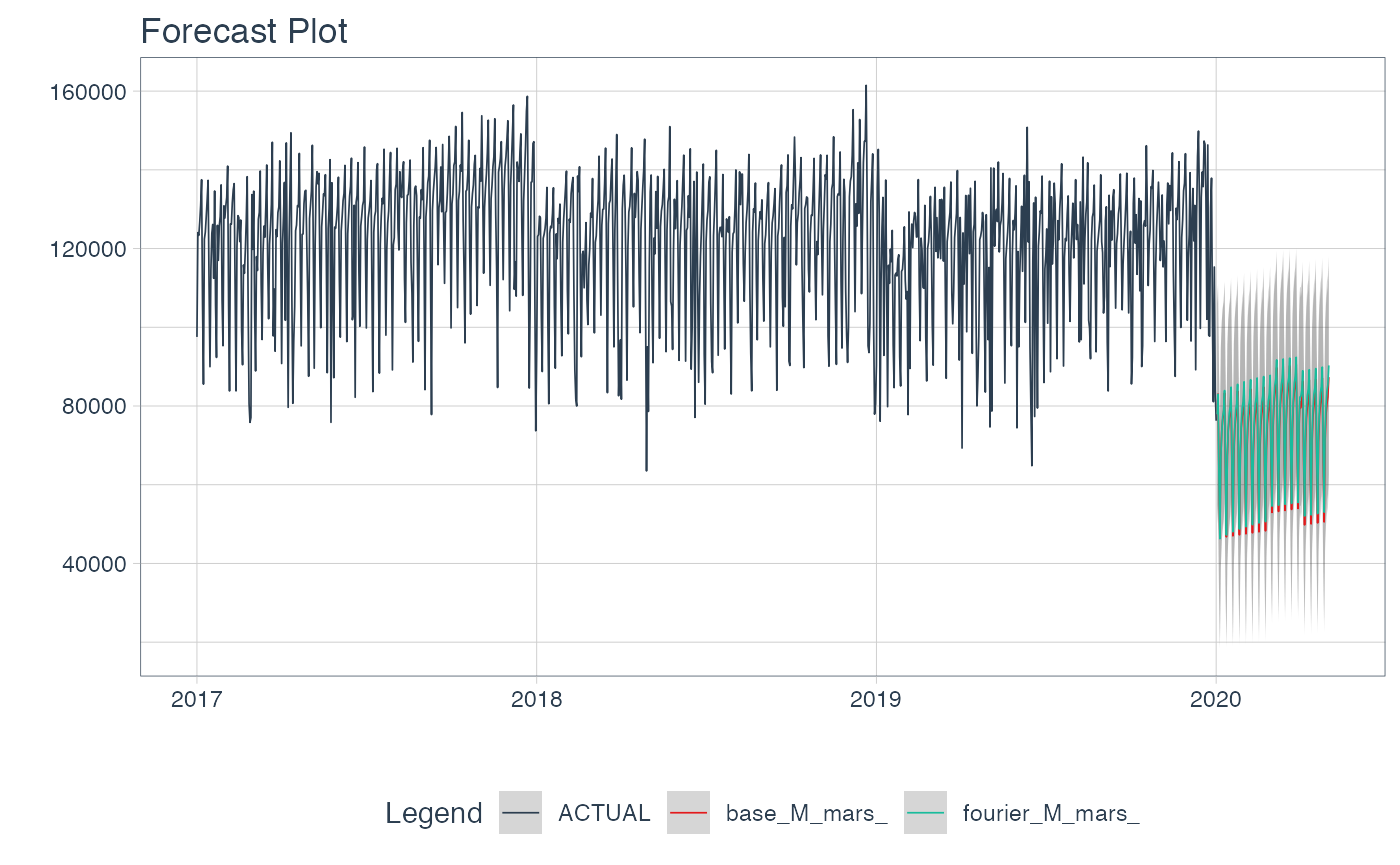
Forecast to the future
# Future forecast ---------------------------------------------------------
modeltime_wfs_forecast(.wfs_results=wfrefit,
                                    .series = data,
                                    .h='4 months',
                                    .split_prop = 0.8)  %>%
  plot_modeltime_forecast(.line_size=0.3, .interactive=FALSE)